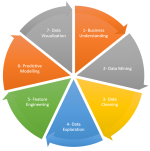
If you want to make a correlation analysis with big data basically you should follow these steps below:

This process involves multiple stages, from data acquisition to results interpretation.

This process involves multiple stages, from data acquisition to results interpretation.
- Understanding the Problem Statement: The first step involves understanding the problem at hand, the scope of the study, and the variables of interest. This helps in formulating the right hypothesis to test.
- Data Acquisition: In the second step, you need to acquire the data relevant to your study. With Big Data, this could mean obtaining large volumes of data from a variety of sources, such as databases, data warehouses, APIs, web scraping, IoT devices, and more.
- Data Cleaning & Preprocessing: This step involves cleaning and preprocessing the data to remove any anomalies that could affect the outcome of the analysis. This includes dealing with missing values, duplicate values, outliers, inconsistent data, and transforming data to suitable formats.
- Data Reduction: Given the massive volume of Big Data, it's not feasible to analyze all of it at once. Therefore, it's important to perform data reduction techniques like sampling, dimensionality reduction, feature selection, or binning to make the data manageable.
- Data Exploration: Explore the data to get a sense of the relationships between variables. This could involve creating visualizations, computing summary statistics, or applying other exploratory data analysis techniques.
- Choosing the Appropriate Correlation Coefficient: Depending on the nature of your variables (categorical or continuous) and the distribution of your data, choose an appropriate correlation coefficient. For instance, Pearson's correlation for normally distributed continuous variables, Spearman's rank correlation for ordinal variables, or Kendall's Tau for ordinal or discrete variables.
- Computing the Correlation: Use a suitable big data tool or platform (like Hadoop, Spark, or a cloud-based solution) to compute the correlation. This can involve writing scripts or using built-in functions, depending on the platform.
- Hypothesis Testing: After computing the correlation, perform a statistical test to determine if the correlation is statistically significant, i.e., if it is different from zero. This could involve computing a p-value and comparing it with a significance level.
- Interpretation of Results: If the correlation is statistically significant, interpret the results in the context of the problem statement. This would involve explaining the strength and direction of the correlation and the implications for the variables involved.
- Documentation and Reporting: Finally, document all the steps, assumptions, methods, and results. It's important to communicate your findings effectively to both technical and non-technical audiences, with clear visualizations, summaries, and explanations.
Last edited:
