The exact formula for the p-value depends on the type of statistical test being used. However, we can outline the general process and provide formulas for a few common tests.

Where:
T is the random variable representing the test statistic under H0
tobs is the observed value of the test statistic
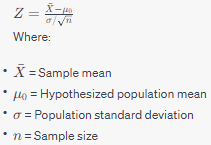
Z-test (for population mean when the population standard deviation is known):

To find the p-value, you'll compare the computed Z value to the standard normal distribution.
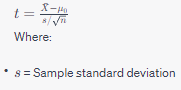
2. T-test (for population mean when the population standard deviation is unknown):

For the t-test, you'll compare the computed t value to the t-distribution with \( n-1 \) degrees of freedom.
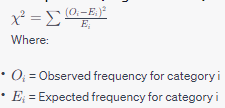
3. Chi-Square Test (for goodness of fit):

The p-value is determined by comparing the calculated X^2 value to the chi-square distribution with k-1 degrees of freedom, where k is the number of categories.
In practice, you'd use statistical software or tables (like the Z-table, t-table, or chi-square table) to find the p-value corresponding to the computed test statistic.
It's essential to understand the assumptions and conditions under which each test is valid to ensure that the computed p-value is meaningful.
General Principle
The p-value is the probability of obtaining a test statistic at least as extreme as the one computed from the sample, assuming the null hypothesis is true. Mathematically, this can be represented for a two-tailed test as:Where:
T is the random variable representing the test statistic under H0
tobs is the observed value of the test statistic
Common Test Formulas:
Z-test (for population mean when the population standard deviation is known):
To find the p-value, you'll compare the computed Z value to the standard normal distribution.
2. T-test (for population mean when the population standard deviation is unknown):
For the t-test, you'll compare the computed t value to the t-distribution with \( n-1 \) degrees of freedom.
3. Chi-Square Test (for goodness of fit):
The p-value is determined by comparing the calculated X^2 value to the chi-square distribution with k-1 degrees of freedom, where k is the number of categories.
In practice, you'd use statistical software or tables (like the Z-table, t-table, or chi-square table) to find the p-value corresponding to the computed test statistic.
It's essential to understand the assumptions and conditions under which each test is valid to ensure that the computed p-value is meaningful.